

Kagi charts are a technical analysis tool that helps investors interpret price movements and trends in the market. Kagi charts are composed of a series of vertical lines, each representing a specific price point. The lines are connected to form a pattern, which can help investors identify buying and selling opportunities.
The basic idea behind a Kagi chart is that when the price moves above the previous line, it is a buy signal, and when the price falls below the last line, it is a sell signal. The length of each line is not important, and it is not necessary to draw all the lines to get a clear picture of the trend. Kagi charts can be used to spot both short-term and long-term trends.
They are often used to identify reversal points or when the market starts to trend in a new direction. But are Kagi charts the only way to analyse price changes and trends? There are plenty of alternatives to Kagi charts available today. This article will discuss some of these alternatives to keep your options open.
Bollinger Bands
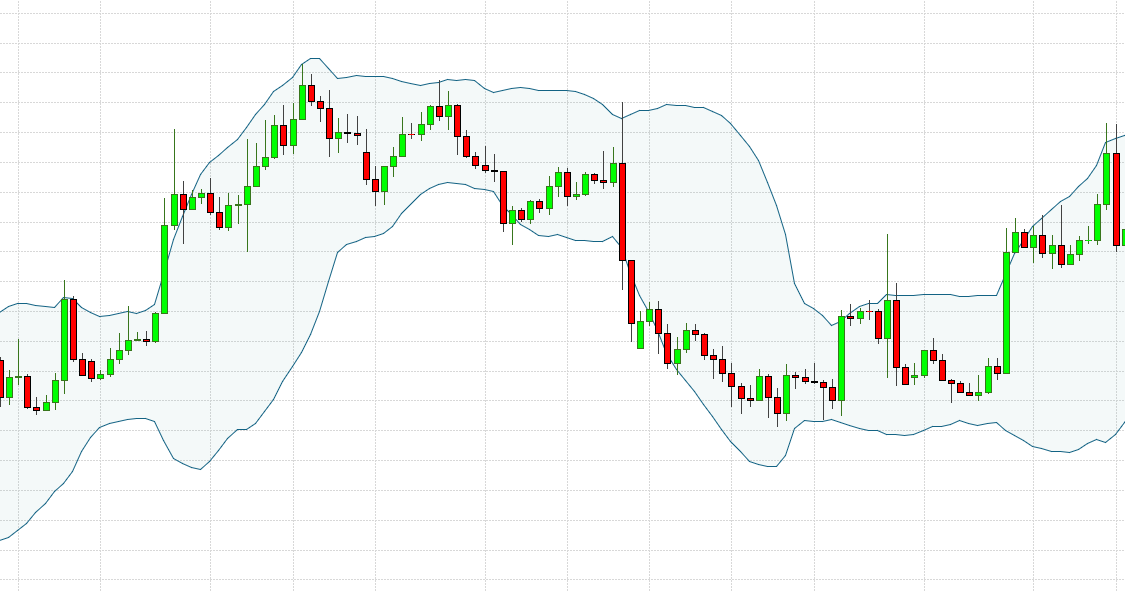
Bollinger Bands are a type of technical analysis indicator that use a moving average and two standard deviations to measure price volatility. The bands are then plotted around the moving average. The upper band represents the two standard deviations above the moving average, and the lower band represents the two standard deviations below the moving average. When the security price falls outside the bands, it is often interpreted as a sign of increased volatility. Bollinger Bands can identify overbought and oversold conditions and generate trading signals.
Candlestick Charts
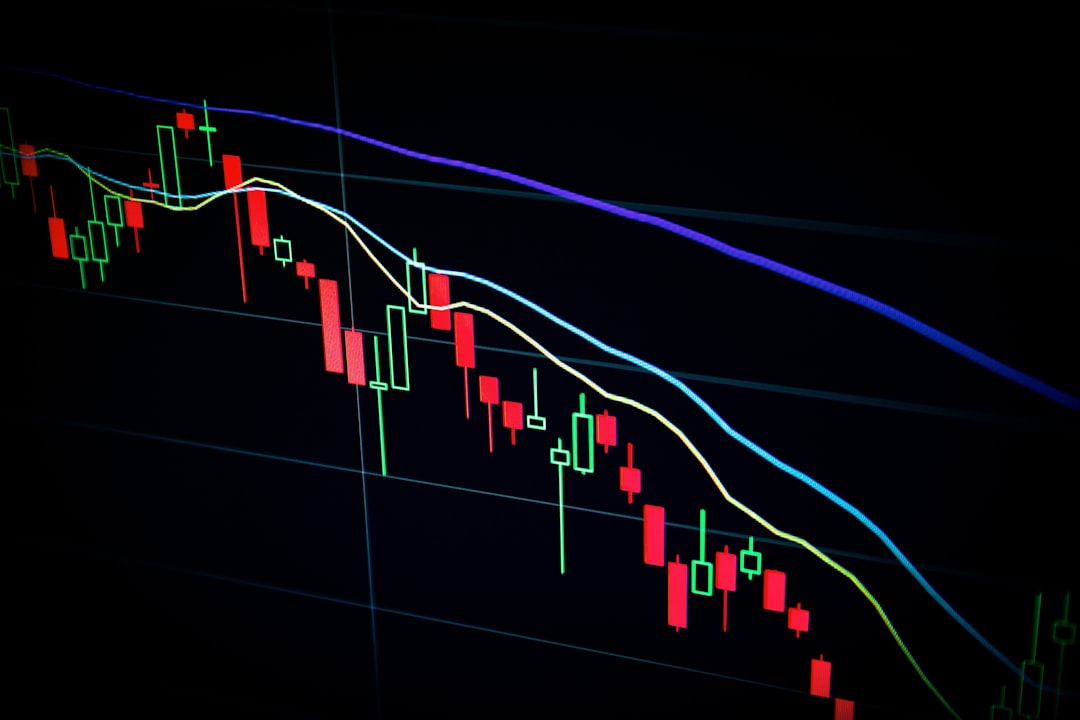
Candlestick charts are price charts used by traders in the stock market, Forex, futures, and cryptocurrency markets originating from Japan. They are composed of thin, vertical lines representing the high and low for the given time and thick, horizontal lines representing the closing price.
The American candlestick chart is slightly different from the Japanese candlestick chart and comprises three elements, including the body, the wick, and the tail. The body is the thick, horizontal line that represents the closing price. The wick is the thin, vertical line representing the high and the low. Finally, the tails are the thin, vertical lines representing the opening and the closing prices.
Point and Figure Charts

Point and figure charts are a technical analysis tool that plots price movements on a chart. The primary use of point and figure charts is to identify price patterns. Then, these patterns can be used to predict future price movements. Point and figure charts are not as popular as other analysis tools, but they can be used to generate buy and sell signals.
Point and figure charts are created by drawing price movements on a graph. The chart is then divided into columns and rows. The columns represent time, and the rows represent price. A box is created when the price changes by a certain amount. The size of the box depends on the chart settings. The box will be filled in when the price movement is confirmed.
Renko Charts
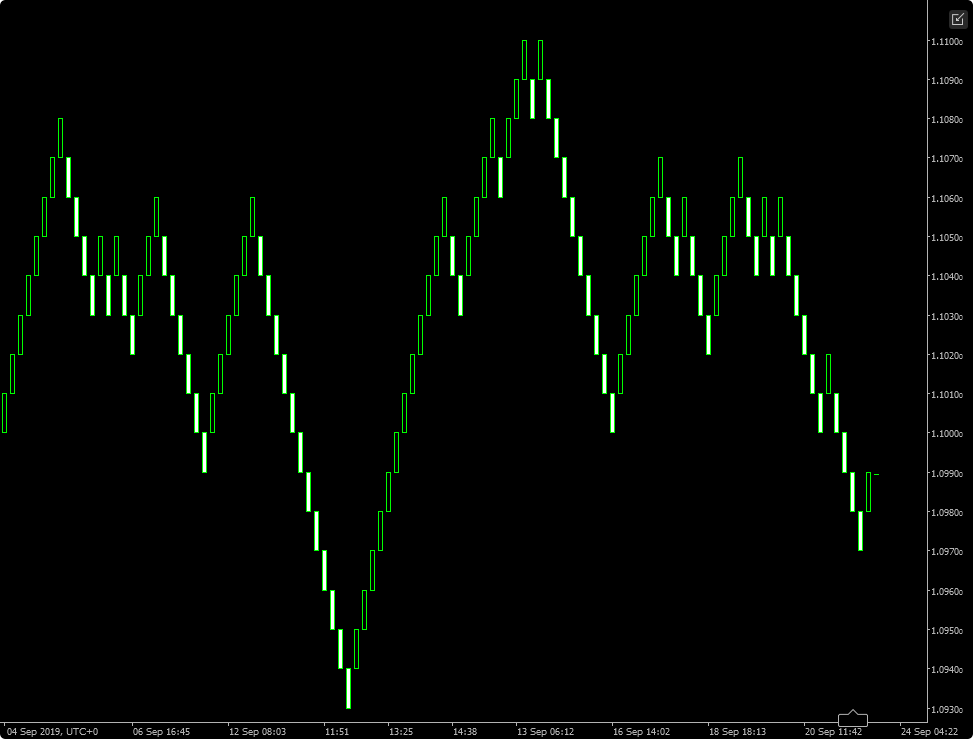
Renko charts are another financial chart hailing from Japan. These charts use colored blocks made up to resemble a line graph. The red bricks signal a down change, while the green bricks signal an upward shift. Similar to Kagi charts, Renko charts have no set time scale. Instead, the bricks only form as a result of movement. If there is no movement, no bricks form. However, they usually only use a closing price.
This chart can be a valuable tool for traders because it eliminates a lot of the noise found in traditional charts. It can also help identify trend changes. Because the bricks are only formed when there is a movement, it’s easy to see when a trend is starting or ending.
Start Charting
The Kagi chart may be a popular, simplified chart for tracking price changes in the financial market. However, sometimes you need to utilise other avenues for your analysis. Now that you know some alternatives for the Kagi chart, you can start using these various charts for your investments.